We can't find the internet
Attempting to reconnect
Something went wrong!
Attempting to reconnect
Analysis Summary
Ask yourself: “Did I notice what this video wanted from me, and did I decide freely to say yes?”
Performed authenticity
The deliberate construction of "realness" — confessional tone, casual filming, strategic vulnerability — designed to lower your guard. When someone appears unpolished and honest, you evaluate their claims less critically. The spontaneity is rehearsed.
Goffman's dramaturgy (1959); Audrezet et al. (2020) on performed authenticity
Worth Noting
Positive elements
- This video provides rare physical comparisons and weight/thermal data for niche, high-end AI workstations that most users cannot access personally.
Be Aware
Cautionary elements
- The use of a high-profile figure (John Carmack) in the title to 'correct' the record functions as an authority-based hook to lend unearned weight to a hardware review.
Influence Dimensions
How are these scored?About this analysis
Knowing about these techniques makes them visible, not powerless. The ones that work best on you are the ones that match beliefs you already hold.
This analysis is a tool for your own thinking — what you do with it is up to you.
Related content covering similar topics.
Transcript
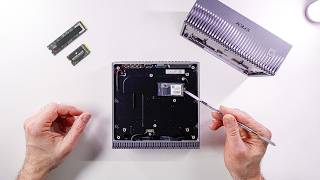
The DJX Spark isn't the only player in town when it comes to having one pedal flop of AI supercomputer on your desk. There's a bunch of these available that have the same Grace Blackwell chip. Grace Blackwell, that's where the GB comes from in GB10, for example, from Dell. The 10 might stand for the 10 high performance ARM cores in here or the 10 energy efficient cores. There's 20 cores in each one of these. Or maybe it's just the model designation. I don't know. But they all share the same chip and the same 128 gigabytes of memory where you can run pretty large models, vision models, agents, video generation, training. I saw a bunch of these at GTC and while they have the same board, they are a bit different. They have different cooling solutions, different NVME drives and sizes, different looks and designs, and of course, different costs. So, I want to find out if the physical differences in the chassis design makes a difference when it comes to thermal performance, power draw, and whether that matters or not. They all come with the same operating system, DGXOS, which is basically Ubuntu with a couple of things sprinkled on. And a lot of these AI tools that you would normally have to install, but you don't have to because they're already pre-installed. They do have different backgrounds, but that should make a difference. Got the DJX Spark. There's only one variety of that. I've got the Asus GX10. It's called the Ascent GX10, but I just call it GX10. And this is the 1 TBTE version. There are three different versions, just different sizes of drives and different NVME generations. Uh, we'll talk about that shortly and whether that matters. I got the Dell GB10, which is called the Dell Pro Max GB10, and the MSI Edge Expert. And when they're powered on at idle, they're using slightly different amounts of power. Real quick here. I just heard from Nvidia that they're giving away one of these sparks to you folks. You just have to attend a session at GTC that's coming up in March either virtually or in person. But I'll have the full details for you very shortly. Just subscribe to the channel and I'll make sure you know about it. Nvidia giving away a DJX Spark. I'm not saying I'm jealous, but I'm also not saying I'm not jealous. Either way, I've got to keep the test bench running, and today's sponsor helps make that happen. So these days, I'm always flipping between models. GPT for research, cloud for coding, nanobanana for image generation, VO cling and runway for video, six tabs, six bills and counting. Enter chat LLM teams. One dashboard houses every top LLM and route Olympics to write one. GPT Mini for ultra fast answers, Claw Sonnet for coding, Gemini Pro for massive context. They recently added Gemini 3 and GPT 5.1 the moment they dropped. Create professional presentations with graphs, charts, and deep research detailed content. Need human sounding copy? Humanize rewrites text to defeat AI detectors. Need visuals? Pick frontier or open-source models. Nano banana midjourney flux for images. Magnific upscaling plus VO WAN and Sora for video all built in. You also get Abaca's AI deep agent to pretty much do anything. Build full stack apps, websites, reports with just text prompts and deploy them on the spot. They have Abacus AI Desktop, which is the brand new coding editor and assistant that lets you vibe code and build productionready apps. And the kicker, it's just $10 a month, less than one premium model. Head over to chatlm.abacus.ai or click the link below to level up with Chat LLM teams. None of these will fit into a single rack space. Unfortunately, they're all too tall. Some are taller than others. The ASUS probably three or four millimeters taller than the Spark and the Dell and so is the MSI box, but the Spark and the Dell are almost identical. Spark of course is the reference design which get shared with the OEMs and the OEMs pretty much can go wrong with it and Dell looks like they really ran with it. The only thing Dell did was a couple of nice little additions. They kept it mostly the same, but the front grill is more manageable, I guess, than something like this. This looks cool, but how are you going to get the dirt out of it? I guess you can ask the same thing about all these. This is a nice honeycomb shape. The ASUS is all metal except for the top, which is plastic. And the MSI feels like it's plastic all around. MSI has small honeycomb pattern. But look at this. The ASUS has a power button right on the front there. Very convenient. Now, I know that some people will say, "Oh, you're keeping these in a rack. So what?" Well, even in a rack, I want to sometimes turn them on and off. and having it in the front is way easier than reaching around the back. Speaking of the back, some of these are labeled and some of these are not. The DJX Spark is very, very clean, not labeled. I do prefer some labeling going on, like for example, these. What USBC is that? I don't know. The Asus one labels it 20 gigs and display port. Dell just says 20 Gbit per second. MSI does say PD out, display port, and 20 Gbit per second. So definitely a lot more labeling on that MSI. What about this port? What is that? Well, it says here that it's 10 GB and here and here, but it doesn't say it on the Spark. And this one says Connect X7. This one says connect X7 with 200G. And this one just says QSFP. The Spark, of course, doesn't say anything. The Dell decided not to label the HDMI port at all. It's pretty clear that it's HDMI port, but it would be nice to also say, oh, it's 2.1. But these don't do that either. They just say HDMI, which I guess is not strictly necessary. Weight wise, I bet you the Spark is going to weigh the exact same. 1,255 as the Dell, probably close. 1,256. [laughter] Then the ASUS one feels heavier. So, let's see. 1,474. Wow. 220 g more. And the MSI feels a little bit heavier. 1,257. So, the ASUS is definitely by far the heaviest one. Maybe it's some kind of uh copper piping or something in there. Some extra cooling. Who knows? back panel access. Why would you need to do that? Because you really can't do any kind of swapping of RAM. You could actually upgrade the SSD in there if you wanted to. You could buy a cheaper 1 TBTE version of this of the ASUS, for example, and then put in a 4 TB drive in there. Save about 500 600 bucks. Now, getting in there is pretty easy on the Spark. It just pops off. It's a magnetic cover. really easy. On the Dell, it's the same kind of magnetic cover, but it's a lot more difficult. There's also six magnets holding it down, where on the Spark, there's four. They need to put in all this writing on the back for legal reasons, and they wanted to keep it clean, so they have this magnetic plate. That's why they did it. There's no other reason to access this panel. They also hid the screws inside there, so it looks cleaner on the Dell and on the Spark. Here, they just stuck the labels right in the back. Who cares? Cuz you're not going to see that anyway. And we have little rubber feet here instead of a little panel. It's very cool. You don't lose your little screws cuz it's right next to the magnet. The screws come out. They stick to the magnet. So on the Dell and the Spark, the Wi-Fi antennas are right here, which means you have to be very careful when you pop this open. So this right here is a 2230 size drive and [music] that drive that's on all these is actually bigger than that. So that's a 2242 would be my guess. And it's exactly the same accessibility on the Spark on the Dell and on the MSI right over here. Easily accessible on the Asus though. It looks like you're going to need to dig a little bit more. [music] I'm making you work for it. Yeah, there it is. Not bad. Also, 2242 as far as I need to go because that's going to be the serviceable part, the part that you can actually swap out if you need to. Now, when I kick off some inference on these machines and I go pretty hard in a loop, they all start to have the fan noise. It's very quiet. It's nothing like a 50 series GPUs at all. These are very quiet machines. If I had to pick the quietest one, I would say the DJX Spark is the quietest one, but it's also very difficult to measure this kind of thing without an Aquoic chamber. The Dell is also very quiet. The loudest one I'd say is the MSI one, but aside from that, temperature- wise, they're all pretty close to each other. We do see a couple of hot spots here and there on some of these, but overall, in general, they hover right about that 50° mark when they're completely heat soaked. They do have very different surfaces, so they might feel a little bit different. For example, the Asus one has this totally plastic cover up on top, which does not feel as hot when I touch it. The Spark feels pretty hot. The Dell feels just about the same. The MSI one doesn't feel as hot, and the power used on each machine is pretty close. So, if we run just a little bit of that, it doesn't really give us a whole picture because these machines are going to be used probably for not just a one-off inference. They're probably going to be used longterm for training or as machines that host and orchestrate agents that go to work for a while. So, what happens on these things if they run for a little while and they reach that point where they're heat soaked? That's when the cooling system, the heat sink, the vapor chamber, the chassis, internal air, even the PCB, that's when they've absorbed enough heat and long enough that the system reaches kind of a steady state in temperature. And this usually happens around 30 minutes of work. That's what we got to check. So, of course, I wrote a bunch of scripts in order to be able to do that and analyze the charts. And while they're mostly boring, which is good actually, this is the kind of information you want to know when you're deciding between a $4,000 machine, a $5,000 machine, or a $3,000 machine. But there are a couple of instances where I saw some interesting results that might matter for some of you. Now, when the Sparks came out, you might have seen this from John Carmarmac, the John Carmarmac from Doom, a legend of Doom. The DJX Spark appears to be maxing out at only 100 watts power draw, less than half of the rated 240 watts. Well, the power adapter is 240 watts. It doesn't mean that the Spark is supposed to be 240 W, but okay, I get your point. There's a lot of headroom there. And it only seems to be delivering about half the coded performance. Hm. Some people ran with this and decided to write headlines that are catchy like this. OG Doom legend John Carmarmac says his Nvidia DJX Spark Box has thermal throttling issues. That's not what he said. It could be interpreted that way, I suppose, if you're trying to get clicks. But let's see what's actually happening here. By the way, for those of you that are not familiar with what the difference is between thermal throttling and what John is talking about, thermal throttling is when the system gets so hot that the CPU speeds are actually knocked back a little bit. So, let's say this CPU is supposed to go at 3 GHz. I'm just throwing out a number there. I think it's a little less than that. And then if it hits like 100° or 110° C, then the speeds are going to be slowed down to maybe two or less GHz. That's thermal throttling. But that's not what's happening here, at least for the most part. So, let's see what happened here while I ran a real model. I ran quen 34 billion small model but I wanted to see how it behaves across all the machines and if there's any issues that we can detect while it's running. So I logged all this information every second for the entire run about 45minut run which gave us enough GPU and CPU heat soak. Now this was running llama CPP so the GPU utilization came to about 96% it hovered around that area the whole time. The temperature of the GPU hovered around 80° once that heat soak threshold was passed and the power draw from the GPU only was about 65 watts. By the way, we're looking at Dell here, but just as an example, the whole time the clock speed stayed pretty much the same. So, while this is showing 64 watts of power by the GPU, the CPU is also working. The rest of the system is also working, the memory, all that is drawing power. And all that added up to about 140 to 160 W. Oh, in case you're interested in the actual results of token generation and prompt processing, there was hardly any difference at all there. So, if we take a look at PP 4096, this is a prompt processing phase. And yeah, we're hitting like good tokens per second, 1,976, and it's about the same on all the machines. Token generation 8192. By the way, that's the max token that we're setting when we're doing this token generation. We're getting 61, 61, 61, and 61. Uh yeah, small model, not a big difference. Now, the average power draw for the last 600 seconds, slightly different story there. The Spark actually drew a little more wattage than the rest of them. 66 on average, about 60 for the GX10 and MSI box, and about 62.7 for the Dell box. The Spark a little bit more, but they're all very close. And the clock speed shows no throttling on any of these. Now, this is not a time chart, but this shows the average for the last 600 seconds. Let me show you the time chart. Here's the Dell. We see the temperature, that's the blue line, rising, rising, rising, and then eventually hits about a steady pace right over there. That's when the heat soak is finally reached. And that's the threshold that we see after about 1,54 seconds have elapsed. The power is pretty stable with a zigzag, but I guess that's just how it works. Up and down, up and down a little bit. But overall there is no big drop in power that I've noticed here. And the clock definitely no signs of throttling at all here even after heat soak was reached and it kept going. If we look at GX10 pretty much the same story MSI very similar story here as well and the spark. So I thought okay let's run a bigger model. So I ran Neotron 30 billion parameter model and this was the unquantized version. pretty decently sized model pushing the limits of what you can run on these machines safely along with some context. Again, what a boring pee pe uh I mean a boring prompt processing uh output here. Dell tokens per second, 168, 1,68 for the GX10, 168 for the MSI, and 1,070 for the Spark. Come on. Really? They're all really the same power usage. Spark is a little bit more as usual. Ah, the time series looks a little bit different here than the uh smaller model. Temperature is slowly rising, but the power usage remains pretty constant. None of that zigzaggy stuff that we saw on the smaller model. Interesting. GX10 looks about the same. MSI, wo, the clock speed drops over here. That's kind of interesting. But it turns out that this is just a charting artifact. If we take a closer look, this is 2476 up here. 2463. And even at the bottom, it's 24,431. So really not that much more different. And there's the Spark about the same again. So I thought, okay, the small model and the big model, they're slightly different the way they run and the way they show up in charts. And the bigger model uses a little bit more power, but what if we really push the system? In fact, here on Twitter, somebody suggested doing a GPU burn, which is just an open- source library that you can run that maximizes the RAM. It maximizes the GPU usage. Basically kicks the machine quite hard. LLM's at a highly optimized level. Really took advantage of everything. I'm doing llama CPP here, so maybe it's reaching 96%, but let's say we really hit it hard. Well, I did that, and that's when we saw some differences. So, we talked about throttling. Now, let's talk about power cap. And that's what John ran into. Yeah, John. Uh, him and I on the first name basis, you know. Not really. I just played a lot of Doom when I was little. Check this chart out. This is power cap sustain. Ooh, now we're seeing some differences. What's happening here? Well, the GX10 is showing that it's actually being power capped for a longer period of time than the other machines to spark the least. Now, does that mean it's throttling? No, it's not throttling. The CPU clock stays consistent across all the machines, and that's good news. And this data is actually coming from these runs right here, the ones I showed you at the beginning where we see the temperatures, the power, and here we're seeing slightly higher temperatures. We're going up to 70°, 71, 74, 75, 76. Woah, we're going up to 81°. And this last column is showing us SW power cap, which is a switch that's flipped when the system initiates a power cap. This isn't a thermal event. It's the system hitting a power limit and it's actually capping at just under 100 watts for the GPU. Well, it may be 100, but it's showing up as 99.12 here. And that's the number that John was talking about. Johnny, oh boy. What does this tell us? And this tells us that it's being artificially limited in software by all these machines. So, in theory, next year, Nvidia could release a software update that would raise that cap and make our machines more performant. So, here we see the software power cap. And this is for this many seconds it happens. then it turns off and then it turns back on and it keeps going like that. But there's only one machine where the software power cap happens and then we see a thermal throttle event as well. That's this right here, the GX10. So you can see we've got nothing, nothing, nothing. Then we have the software power cap and then after a while we see a software thermal slowdown. And over here this is where the power draw suddenly drops from 96 to 76. Now, it doesn't register the clock speed as being much lower here. Maybe because it happens between the seconds or because it happens so quickly, but we did receive that signal from the operating system. Here's another one. It happened twice here. And I'm not even sure why it happened because the temperatures here are 95 whereas we saw temperatures of 99 on the Dell box and it didn't happen there. So, this is on the ASUS machine. So, if we take a look at the time series for this, here's the Dell. pretty standard looking. Slightly different power uh characteristic there. Here is the MSI box. Power cap sustained is over here. Pretty early on because we are getting there pretty fast. Power cap sustain is really early on here on the Spark. And then let's take a look at the GX10. Well, power cap sustain is early on, but then we have the first thermal slowdown right here. Now, just because the system detected it and it's showing it to us, does that mean that we see like a big dip in performance? I don't think so. I mean, look at the chart. If we zoom in here, yeah, it looks pretty much the same on the right as it does on the left. So, I don't think it's going to really matter that much here. Now, I haven't tested all the different DJX Sparks out there, just these four. However, Storage Review just came out with this. Looks like they have a very similar picture to what I took. That's not my picture though, is it? Better not be. I'll link to this post down below so you can check it out. They did Gigabyte Acer, Asus, and Dell. Very similar results. However, the Acer system stands out immediately, peaking at just 76° during demanding prefill heavy scenario, while the other systems climbed into the mid to upper 80s, which is what I saw. So, according to their test, the Acer system is doing actually better than all of them. But I can't confirm that cuz I haven't tested that myself. Acer, if you're listening and you want to send me one of them, I'm open to that. Thanks to a subscriber for pointing out this article, by the way. Now, besides temperatures, that's not the only difference between these machines. We also have a difference in the drives, the NVME drives. And out of the ones that I have, the DJX Spark, the Nvidia one, is the only one that has the Gen 5 drive in it and the controller. All the other ones have a Gen 4. Does that make a difference? Well, kind of. For example, here I have a script that detects the kind of drive we have just so I can prove it to myself and not just read the labels because actually some of them don't even make this very clear. Here we got the Spark Gen 5 32 gig transfers per second PCIe X4. Here's the ASUS Gen 4. Here is the Dell Gen 4 16 gig transfers per second. And here's the MSI Gen 4. Now, normally you'll see a difference, a slight difference if you're copying a very large file. And yeah, the Gen 5 drives are much faster. I get over 13,000 megabytes per second, whereas on the Gen 4, I get about 7,000. But what about not copying files? What about the tasks that these are actually meant for? Well, that does matter, too. But only when you're first grabbing that model off the disc. In a cold start scenario, when you want to load a model up, if you're doing this multiple times, if your agents are using different models and they're going out and grabbing different models, then you might see a slowdown. Eventually, things might take a little bit longer. For example, here's how long it takes to load up and time to first token of that Neotron 30 billion. 8.49 seconds on the Spark with that Gen 5 drive and about 11 1/2 seconds on the other machines. And of course, the bigger the model, then the longer it's going to take. So hopefully this was eye opening and interesting to you. Let me know in the comments down below what you think, which one is your favorite. And I'll see you in the next video.
Video description
Stress-testing the NVIDIA DGX Spark, Dell Pro Max GB10, ASUS Ascent GX10, and MSI Edge Expert revealed the real limiter behind the “throttling” headlines. Try out ChatLLM - http://chatllm.abacus.ai/ltf and Abacus AI DeepAgent - http://deepagent.abacus.ai/ltf My USB-C portable hub: https://amzn.to/4kw0hrf 👀 My favorite external drive (dependable): https://amzn.to/3Os9Wi3 👀 Thunderbolt 4 dock: https://amzn.to/3yVRicC 👀 Thor on NVIDIA Marketplace: https://bit.ly/44j0acY 👀 Spark and Thor on Amazon: https://bit.ly/4pCjBpJ 👀 M4 Pro Mac Mini deal: https://amzn.to/3Mw8dNx ⚡ *Other gear I use:* https://www.amazon.com/shop/alexziskind 🎥 Related Videos 🎥 🧬🐍 Mac Studio CLUSTER vs M3 Ultra 🤯 - https://youtu.be/d8yS-2OyJhw 🧳🧰 Mini PC portable setup - https://youtu.be/4RYmsrarOSw 🍎💻 Dev setup on Mac - https://youtu.be/KiKUN4i1SeU 💸🧠 Cheap mini runs a 70B LLM 🤯 - https://youtu.be/xyKEQjUzfAk 🧪🔥 RAM torture test on Mac - https://youtu.be/l3zIwPgan7M 🍏⚡ FREE Local LLMs on Apple Silicon | FAST! - https://youtu.be/bp2eev21Qfo 🧠📉 REALITY vs Apple’s Memory Claims | vs RTX4090m - https://youtu.be/fdvzQAWXU7A ⚡💥 Thunderbolt 5 BREAKS Apple’s Upcharge - https://youtu.be/nHqrvxcRc7o 🧠🚀 INSANE Machine Learning on Neural Engine - https://youtu.be/Y2FOUg_jo7k 🧱🖥️ Mac Mini Cluster - https://youtu.be/GBR6pHZ68Ho * 🛠️ Developer productivity Playlist - https://www.youtube.com/playlist?list=PLPwbI_iIX3aQCRdFGM7j4TY_7STfv2aXX — — — — — — — — — ❤️ SUBSCRIBE TO MY YOUTUBE CHANNEL 📺 Click here to subscribe: https://www.youtube.com/@AZisk?sub_confirmation=1 Join this channel to get access to perks: https://www.youtube.com/channel/UCajiMK_CY9icRhLepS8_3ug/join — — — — — — — — — 📱LET'S CONNECT ON SOCIAL MEDIA ALEX ON TWITTER: https://twitter.com/digitalix — — — — — — — — — ⏱️ Chapters 00:00 Hardware Tour 06:00 Test Setup 09:20 Throttling Claims 10:46 Test Workload 13:38 Bigger Model 15:04 Stress Testing 19:56 Storage Impact #dgxspark #nvidia #llm