We can't find the internet
Attempting to reconnect
Something went wrong!
Attempting to reconnect
Dreams of Code · 38.0K views · 1.4K likes
Analysis Summary
Ask yourself: “Did I notice what this video wanted from me, and did I decide freely to say yes?”
Worth Noting
Positive elements
- This video provides a practical, step-by-step guide to configuring Uptime Kuma, including useful non-obvious settings like heartbeat intervals and retry logic.
Be Aware
Cautionary elements
- The deployment method is specifically chosen to highlight a sponsor's feature, which may not be the most cost-effective or efficient method for every developer's specific needs.
Influence Dimensions
How are these scored?About this analysis
Knowing about these techniques makes them visible, not powerless. The ones that work best on you are the ones that match beliefs you already hold.
This analysis is a tool for your own thinking — what you do with it is up to you.
Related content covering similar topics.
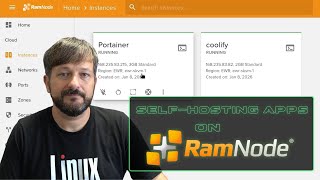
How to Deploy Self-Hosted Apps on a RamNode VPS
Learn Linux TV

Doppler is without a doubt my favorite secrets management platform
Dreams of Code
if you're running Docker you NEED to checkout Dockhand!
TechHut
AI Agents That Actually Do Work (2 Real Examples)
Travis Media
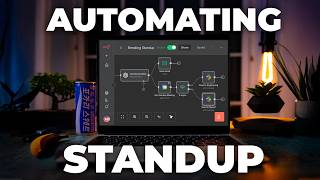
I may have just broken standup (using n8n)
Dreams of Code
Transcript
One of the only real things in software development that keeps me up at night is downtime. Uh, sometimes quite literally, as anyone who's received a 2 a.m. pager of duty alert knows all too well. Fortunately, when it comes to my deployed applications, downtime isn't that common of an occurrence. However, because I've been increasing my use of tools such as clawed code, where I'm effectively trading stability for speed, then the likelihood of one of my applications suddenly going offline has substantially risen. Because of this, and because I want to be able to sleep at night without constantly worrying about whether or not my applications are experiencing any downtime, then I've been taking steps to ensure that I'm informed whenever this is the case. One of the best ways to achieve this is to make use of an uptime monitoring tool, which is used to notify you whenever downtime is detected on a configured web application, allowing you to take action before it affects too many users. Whilst there are a number of different products out there for uptime monitoring, uh there's one that I've been using quite a lot recently that I would consider to be almost perfect as it not only supports nearly everything that I need when it comes to uptime monitoring, but it also happens to be open- source, self-hostable, and if I'm being completely honest, it looks great. This service is Uptimekuma, which I've been using to monitor all of my production web applications for the past few months. However, that's not all I've been using it for. as it provides a number of other features that make it incredibly useful for monitoring your infrastructure stack including API endpoints, database instances such as Postgres, MySQL or Reddus, uh VPS firewall configurations, DNS records, TLS certificates, and even individual Docker containers. If that wasn't good enough, however, Uptimekuma also provides a status page which is linked to all of your uptime monitors, allowing you to communicate any maintenance windows or downtime events with your users. All of this for me makes Uptimekuma almost the perfect uptime monitoring tool. And whilst there are a couple of features that I do find missing, overall it's an absolutely fantastic service, especially as you can host it yourself. So let's go ahead and take a look at not only how easy it is to deploy an instance of Uptimekuma, uh, but I'll also show you how I like to configure it for my own application stack, including a couple of monitors I like to configure for my own infrastructure needs. In order to deploy an instance of Uptimekuma, there are a couple of different approaches we can take laid out in the project's readme. The first of these is to deploy it using the pre-built Docker image, which is pretty much expected for any open source service these days. However, the second approach, if you prefer, is to run it directly using something like PM2 as it's a node application. Personally, [clears throat] I'm a fan of using Docker, typically with a deployment platform such as Dock Ploy. However, because it's a good idea to deploy monitoring software onto different infrastructure than it's actually monitoring, I'm instead going to take a different approach and use a new Dockerbased feature provided by my VPS provider and the sponsor of today's video, Hostinger. This feature is their new Docker Manager, which allows you to deploy and manage a Docker composed deployment all from within the Hostinger UI. Docker Manager is available for any hosting or VPS instance that has been set up using the Docker ISO image, which is available to select during the VPS's initialization. This means it's possible to deploy and manage your application stack using Docker Compose without ever needing to SSH in. In my case, I'm going to go ahead and deploy the following docker compose. Which deploys a container for uptime Kuma version 2.0 beta as well as an instance of traffic in order to work as a reverse proxy. If you want to deploy this yourself, you can find a link to the compose.yaml in the description down below, as well as some instructions on what you need to change in order to set it up for your own configuration. When it comes to deploying a Docker Compose stack using Docker Manager, you can do this a couple of different ways. The first of which is to use the visual editor, which allows you to define containers manually through the user interface, making it a great option for beginners or those who are more adverse to YAML. However, if you're a little bit more experienced when it comes to using Docker Compose, then you can instead use the YAML editor view, which allows you to define the Docker Compose stack using YAML. [snorts] Additionally, if you happen to have a Docker Compose already available, then you can either paste this into the YAML editor, or better yet, paste the URL of this Docker Compose directly in, provided it's hosted on the internet. In fact, this is the approach that I'm going to take. pasting in the URL and pressing deploy which takes a couple of minutes to do so. Therefore, whilst we wait, let me quickly take a minute to talk about the VPS instance that I'm using Docker Manager on, which is provided by the sponsor of today's video, Hostinger. The VPS instance that I'm using is the KVM2, which has two vCPUs, 8 gigs of RAM, and a massive 8 TB of bandwidth, which is pretty much what I use to host all of my applications on. Not only this, but because Hostinger currently have a Black Friday sale going on, then the KVM2 only costs $6.49 a month when you sign up for a 24-month term. However, if that wasn't affordable enough, you can actually save yourself another 10% off this already low price by using my coupon code dreams of code when you check out. So to get your own VPS instance to try out the new Docker Manager with, then visit hostinger.com/dreamsofs of code and make sure to use my coupon code dreams of code to get that additional 10% off. A big thank you to Hostinger for sponsoring this video. Okay, if we check back with Docker Manager, you can see that the Uptimekum stack has now been deployed. So let's go ahead and finish setting it up before configuring our first application monitor. In order to do so, I first need to head on over to the host name that I configured for my instance, which I defined inside of my docker compose.yaml. Here you can see I'm greeted with the following page asking me to choose which database I want to use, of which we have three options. Either embedded Maria DB, external MySQL/MARB, or SQLite. If this was a production setup, I'd probably choose an external Maria DB instance if I wanted to have failover or shared redundancy. However, for this single instance, I'm going to go ahead with embedded Maria DB as it provides a little bit more of a performance boost compared to SQL light, although SQLite will work as well. Upon selecting this database, I'm then brought to another page in order to set up an admin account. One thing to note is it's worthwhile to do this using HTTPS, which I do have set up through the use of my reverse proxy in traffic. You can change this to use one of your own domains by modifying the following lines inside of the docker compose. and then adding in the relevant DNS record to point it to your VPS's IP. Okay, if I go ahead and create my admin account, setting both my username and password, you can see that I'm now logged in to Uptimekum's admin panel where we can begin adding in our first uptime monitor. The first uptime monitor that we're going to add is going to be the most simple. Uh, but don't worry, we're going to add in some more advanced ones later on as well as showing a couple of interesting ones that I like to use. For this one, however, we just want to set this up to ensure that the website is up and accessible at its current domain name. As for which website I'm going to configure, this is going to be the most recent application that I vioded for myself, Zenrompter, which is a simple web application that will allow me to run scripts for a teleprompter, which I can use with my phone or on my desktop. This app is one that's very niche, but it perfectly suits my needs. And therefore, I want to make sure that this service is always accessible for whenever I need it. And in the event that it does go down, I will at least be notified. To create a new Optim, we begin by clicking the add new monitor button, which will display the add monitor form. The first thing we want to select inside of this form is the monitor type that we're going to use. Here you can see there are many different types of monitors we can select from, such as ping, TCP port, DNS, and Docker container. We'll take a look at a couple of these later on in the video. However, for this monitor, we want to set it to be the HTTP/HTTPS type, which also happens to be the default. This type is where Uptimekuma will send an HTTP request to the configured domain in order to see if the HTTP request succeeds. If the configured request fails, then the monitor will mark the website as down. This is the most simple and probably the most common monitor type that you can configure. However, we will take a look at some more advanced ones later on. With the monitor type selected, I can then specify a friendly name, which in my case, I'm going to go ahead and set to zenprompter http followed by the URL that I want the monitor to send a request to. For this, I'm just going to go ahead and set it to be https zenprompter.app, which is the base domain for my application. Once that's done, we can now configure a couple of other properties. The first of which is the heartbeat interval, which is the total time in seconds for the interval period that a request will be sent to the configured URL. By default, this is set to 60 seconds, which for my use case is fine. However, if you want to be a little bit more responsive, you can of course set this to something like 15 seconds or even lower. However, one thing to note is that this is a bit of a fine balance and setting this interval too low may result in more false positives. Additionally, it also negatively affects the status page, uh, which we'll take a look at later on in the video. Therefore, you'll want to set this value to be as high as possible or acceptable for your own requirements. Underneath this, we have another field with the label of retries. The value of which is the number of successive times the monitor should retry before determining that the website is down and sending out any notifications. By default, this is set to zero, meaning that the first failure encountered will trigger the website as being down. Personally, I find the value of zero to sometimes be susceptible to false positives, which can often happen when a service is redeploying. Therefore, in order to reduce the likelihood of these false positives from occurring, I like to set this to be a nonzero value, meaning that there needs to be multiple successive failures for a website to be marked as down and a notification to be sent. Therefore, for my case, I'm going to go ahead and set this retry count to be four, which means that there'll be four total attempts after the first one to confirm that the website is down. By default, each of these attempts will be retrieded after 60 seconds, which is defined in the field labeled heartbeat retry interval. For me, this is a little too slow as it can mean that there will be a total of up to five whole minutes before a service is marked down. Therefore, instead, I like to set this to be around 20 seconds, which means it will be roughly around 2 minutes in total. Underneath this, we can then configure the request timeout, which is the total number of seconds where we don't receive a response to a request in order to mark it as failed. By default, this is set to 48 seconds, which personally I think is absolutely fine. The next field is used to configure resending notifications after a number of consecutive down events, uh, which by default is set to zero, meaning that it's disabled. In my case, I'm going to go ahead and leave this as is, mainly because I don't want to get spammed with notifications for the same outage. Underneath this, we have the advanced configuration fields, uh, beginning with four different checkboxes. The first of these is the ability to enable a notification when a certificate is expired. Personally, I think that this is a good option to enable. So, for my monitor, I'm going to go ahead and do so. Next, we have the option to ignore any HTTPS/TLS errors, which in my case, I'm going to go ahead and leave as disabled as I want to receive a notification if we do encounter one. As for the third checkbox, this is a new option available in V2 of Uptimekuma. This option adds a parameter with a randomly generated value, which allows the HTTP check to bypass any caches such as those provided by Cloudflare proxy. because I use Cloudflare proxy which provides a cache. Then I'm going to go ahead and enable this so that my monitor isn't hitting the cached value which could lead to a false negative. The last of the options of these four checkboxes is to enable upside down mode which allows us to invert a monitor in order to send a notification when a website is accessible rather than when it's not. This may seem a little bit confusing but we'll take a look at a couple of examples where this is actually useful later on. Underneath this, we then have the ability to specify the maximum number of redirects, which by default is 10. Then the accepted HTTP status codes in the response, which in our case is between 200 and 299. Next, we have another new addition in V2 called IP family, which allows us to select either IPv4 or IPv6. In my case, I'm going to go ahead and leave this as default, which is auto. Next, we have the monitor group, description, and tags, which we can use to apply metadata or group monitors together. In my case, I'm just going to leave all of these options as default. With that, we almost have our simple monitor set up. You'll notice, however, if I scroll up, that we have a number of other options on the right hand side. These are used for configuring the HTTP request that the monitor will send out allowing us to modify either the HTTP methods which by default is get. Add a request body which can either be encoded as JSON, HTTP form or XML. The ability to add any HTTP headers which is useful for API tokens or other similar things. And lastly, the ability to set up some different forms of authentication such as HTTP basic orth oorthth 2, NTLM or MTLS. For this monitor, I'm going to go ahead and leave all of these as default. Just above these options, however, is something that we do want to configure. This is where we can add in a notification, which is the service that we want to be notified in the event that the monitor does detect that the website is down. So, let's go ahead and add in our first notification. To do so, we can click the setup notification button. And we're presented with a modal dialogue where we can create our notification. Here we can select from a number of different notification types or services such as Telegram, Discord, Godify, and my own personal nightmare, Pager Duty. Despite dreading the 2 a.m. nightmare that is Pager Duty, this is actually one of my preferred notification configurations, as it absolutely makes sure that you're notified in the event that something goes wrong. For this video, however, I'm instead going to choose a service that's a little more chill. Mainly because I don't want to be responsible for a few thousand developers uh potentially being tired for work in the morning in the event that I likely configured something wrong throughout this video. So, I'm instead going to go ahead and show how to set this up using Slack. Uh but feel free to use whichever service you prefer. In order to configure this notification to work with Slack, we need to obtain a Slack web hook URL. Fortunately, Uptimekuma provides a link to the Slack documentation which has a step-by-step guide on how to do this. In fact, Uptimekuma also provides documentation links for each of the notification types that it provides. If we go ahead and click this documentation link for the Slack web hook, you can see it provides us a step-by-step guide on how to achieve this uh which you can easily follow. However, the basic outline is to either create or use an existing Slack application, enable incoming web hooks, and then creating an incoming web hook with the channel you want to post to, which in my case, I'm setting to one called uptime alerts. Although you can override this channel if you want to inside of the Uptimeka configuration. With the incoming web hook created, you can then go ahead and copy the web hook URL, pasting it into the web hook URL field of the Slack notification type in Uptimekuma. With that, we have the required fields completed for our notification. However, there are a couple of other properties we can configure if we want to. In my case, I'm going to leave most of these as their default, apart from enabling the options of send rich messages, notify channel, which will ensure that I receive a push notification even if I'm set to away, and default enabled, which means that this notification type will be enabled by default for any future monitors. Okay, with the notification now configured, let's go ahead and test that it's working by pressing the test button, which should produce a test message in the Slack channel that I configured, which it does. With the web hook confirmed as working, let's go ahead and save this notification, which will automatically enable it for our configured HTTP monitor, which we can go ahead and save as well. Okay, with that, before I go ahead and test that everything is working, one thing to note is that a monitor can have multiple notification services configured. And typically in my case, I like to have both Slack and Pager of Duty set up, which allows me to be notified if I'm at my desk or if I happen to be away. In any case, with the monitor now created and the notification configured, let's go ahead and test that it's working. If I head on over to Docky, which is how I'm deploying this application, and then go ahead and disable the running instance of Zenrompter, we should then see the monitor in uptime Kuma move over to a pending state within 60 seconds. This is where it begins retrying the application or the HTTP request in order to determine if it's still online. After it performs four retries, this will then move over to a failed state. And we should see a notification come through on the configured Slack channel, which it does. Now, [snorts] if I go ahead and restart the application after a few seconds, we should see the monitor go back to being green, and we'll receive another notification on the Slack channel letting us know that our application is back online. With that, we have our first monitor set up with a notification for Slack configured, which will let us know if our website happens to go down. In addition to having multiple notifications, another feature that I commonly use in production is the built-in status page, which allows my users to view the current status of my services, as well as enabling me to communicate any current incidents or maintenance windows. Therefore, let's go ahead and quickly look at how we can set up a status page for the current HTTP monitor before taking a look at a couple of other monitors that I like to configure. To set up a status page, all we need to do is head on over to the status pages section and click the button that says new status page. One cool thing about Uptimekum is that it allows you to have multiple status pages, meaning that you can have one for each of your SAS products. Inside of the form, we can provide a name for the status page as well as the URL slug. In my case, I'm going to go ahead and set these as ZMP promptter for both. Once created, we can then add in the monitors that we want to be displayed on this status page, which currently is just the HTTP monitor. considering that's the only one available. Although we will add a couple more later on. If I go ahead and press save, we now have a status page that we can view at the slug that we provided, which as you can see shows the HTTP monitor we have configured. One complaint that I do have with Uptimekum's status page is that it only shows a short amount of data, roughly 1 hour when you have a 60-second configured heartbeat. Personally, I'd love to be able to configure this so that the range could be a lot larger, i.e. seeing historical statuses for either the past month or even the past year. There is however an open issue for this feature to be added in which one of the maintainers mentioned that they were waiting for v2 in order for this to be possible uh due to performance implications. So for the meantime, we're just going to have to wait and see if it gets added. Despite this limitation, I still like to link to this status page on my production services so that users can see the up-to-date status at any time. This also has the benefit that I can communicate any incidences through this page as well. This is achieved by using the create incident button which displays a form where we can add a title and a description as well as setting an associated color which I like to use for describing the severity of whatever incident I'm creating. Once created, this will then display on the status page, communicating with your users if something is going on. In addition to incidences, Uptimekuma also provides the ability to schedule maintenance tasks through the maintenance page. [snorts] Here we can create a new task with a title and description before then choosing which associated monitors will be affected. [snorts] Next, you can then configure this task to be shown on any or all of your status pages, either by selecting each status page individually or just applying it to all. When it's active, you will be able to see it appear on the status page like so. [snorts] As for the scheduling of these tasks, these can be configured a number of different ways, such as being toggled on or off manually, a one-off task scheduled at a certain time for a certain duration, or configured to be activated on a recurring schedule, which can [snorts] be set up in the UI, or specified through the use of a cron expression. One way that I like to use this is to communicate any performed planned maintenance, such as upgrading a VPS instance size, although I'm yet to have needed to upgrade from the KVM2. On that note, it's worth mentioning that when you do want to perform any tasks that might cause an expected outage, you can pause a monitor to prevent it from performing any checks during that time and subsequently sending any disruptive notifications or affecting your total uptime score. Whilst this status page is a really nice feature to have for free, I do think that when compared to other status pages such as provided by better stack, status page.io, io then the one provided by uptimekuma is somewhat lacking with perhaps the main feature I find missing being the ability for users to subscribe to status update notifications. In any case, now that we have the HTTP monitor and status page set up, let's take a look at some of the other monitors that I like to configure for my infrastructure stack. The first and perhaps my favorite use is to monitor the SSH ports of any of my VPS instances to ensure that they're inaccessible over the public internet. If you've followed along with my channel for a while now, you'll know that this is one of my preferred security approaches, favoring to only allow SSH over my TailNet provided by Tailscale. By doing so, it helps to improve the security posture of all of my VPS instances, although only if the firewall is up and running, which can sometimes be modified inadvertently, especially when using something like Docker. Therefore, by adding in a monitor to check for this, I can rest confidently at night knowing that if my SSH port ever becomes accessible, I'd receive a pager of duty alert letting me know. As for how I have this configured, well, I begin with the monitor type of TCP port, setting the host name to either the public IP or the configured DNS record of my VPS instance and the port to 22. However, currently there's a problem with our configuration because this monitor will actually send out a notification and mark that it's failed in the event that the port isn't accessible. Whereas instead, I actually want this to be an inverse behavior. I.e., I want the monitor to send out a notification when the port is up and the request succeeds. Fortunately, we can invert this behavior by enabling the upside down mode option that we saw before, which will cause the monitor to report an error and send out the notifications only when the port is accessible. And when it's inaccessible, it will mark it as green. Now, if I go ahead and save this monitor, we can see after about a minute that the first request is displayed as green as the TCP request sent by the monitor resulted in a timeout, meaning that the SSH port isn't accessible over the public internet, which is desired. Now, if I go ahead and SSH into my VPS instance using tail scale, followed by disabling the firewall using the following command, which means that SSH will now be accessible. After about a minute, we can see the monitor turn red and a notification come through on my configured Slack channel letting us know that SSH is accessible and the monitor is working as intended. In addition to SSH port monitoring, some other monitors that I like to configure with my application stacks include adding a monitor to ensure that my dev instances or dev versions of my applications are only accessible using the configured basic orth credentials. Another monitor to ensure any publicly accessible API endpoints are both up and available to be used using an API key and DNS records to ensure that they don't accidentally get changed from where they're supposed to be. Not only does this help me to gain coverage of some key areas of my infrastructure, but because of the status page that Uptimekuma provides, then it can help my users to know which service is down when an outage does occur. This is because you can select which monitors will appear on the status page, which is great for communicating whether the issue is across my web page, across the API, or even upstream with my database. Additionally, by making use of the tags feature when configuring a monitor, you can also apply more context on this status page. For example, communicating that the service being monitored is actually a third-party dependency. As you can see, Uptimekuma allows you to set up a wide range of different monitors to not only help notify you when it's just standard downtime, but also to let you know when another part of your application stack goes wrong, which can be really useful when communicating to customers. uh for example if the public API goes down but the website is still accessible. Despite this however there are a couple of missing features that I would like to see added to uptimekuma which for me would give it the perfect classification. The first of these is the ability to monitor for DNS expiration which has bit me a couple of times in the past. This monitor works by notifying you a configured period before a domain is set to expire. Usually 1 month beforehand and then more frequently the closer the expiration gets. Now to be fair, most of the time this is handled by a domain registar. However, I have found in the past that email notifications don't always make it through and having an additional notification come through on Slack just provides a little bit more piece of mind, especially when the credit card that you use for domain renewals happens to go and expire. Fortunately, there is an open issue and a rather promising pull request which looks to add this functionality in. The second major feature that I wish uptime kuma had is the ability to configure monitors through docker labels. The way that I envision this working would be similar to how it does with traffic where you can configure both docker labels and cla arguments in order to set up reverse proxy rules for different services. In this case it would be awesome to do the same thing with uptimekuma meaning that you could easily configure it in a configuration file rather than needing to use the guey to do so. Now to be fair to Uptimekuma, it does provide an API that you can use to configure any monitors and there is an issue open for a Terraform provider which if implemented would allow this declarative configuration. However, I'd still love the ability to be able to do this through Docker Compose. In addition to these missing features, some other features that I really would like to see is the improvements to the status page. So, being able to view more historical data and the ability for users to subscribe to status updates, as well as the ability to add other account users, which currently you can only really have one, which doesn't make it great beyond an individual developers needs. Despite these missing features, however, Uptime Kuma is still a fantastic way to add monitoring to your applications through a self-hosted solution, one that I would consider to be almost perfect. And therefore, for myself, I'm probably going to continue using it for the foreseeable future when it comes to helping me resolve any unexpected downtime as quickly as possible. In any case, I want to give a big thank you to the sponsors of today's video, Hostinger. I've been using them now as my VPS provider for just over a year, and with the release of their new Docker Manager feature, I can't see that changing anytime soon. So, if you want to get your own long-term VPS instance to use with the new Docker Manager feature at an incredibly affordable rate thanks to Hostinger's current Black Friday sale, then visit hostinger.com/dreamcode and use my coupon code dream to code to get an additional 10% off. Otherwise, that's all from me, but a big thank you to you for watching and I'll see you on the next one.
Video description
Even when Amazon breaks the internet... To get your own VPS instance to use with Docker Manager during this black friday sale, then visit https://hostinger.com/dreamsofcode and use my coupon code DREAMSOFCODE to get an additional 10% off Monitoring an application can range from being easy, to being simple. Personally, I like to keep things simple, and use an uptime monitor which will let me know in the event a website is down. However, there are many different uptime monitoring tools out there. Fortunately, I've managed to find one that not only suits nearly all of my needs, but also happens to be open source, and self hostable. This video is sponsored by Hostinger. Video Links - Uptime Kuma: https://uptime.kuma.pet/ - My Docker Compose: https://github.com/dreamsofcode-io/uptime-kuma-compose - Zenprompter Status Page: https://uptime.zenvps.xyz/status/zenprompter - Zenprompter: https://zenprompter.app Watch my course on building cli applications in Go: https://dreamsofcode.io/courses/cli-apps-go/learn 👈 My Gear: - Camera: https://amzn.to/3E3ORuX - Microphone: https://amzn.to/40wHBPP - Audio Interface: https://amzn.to/4jwbd8o - Headphones: https://amzn.to/4gasmla - Keyboard: ZSA Voyager Join this channel to get access to perks: https://www.youtube.com/channel/UCWQaM7SpSECp9FELz-cHzuQ/join Join Discord: https://discord.com/invite/eMjRTvscyt Join Twitter: https://twitter.com/dreamsofcode_io 00:00:00 Intro 00:02:20 Installation 00:03:48 Docker Manager 00:04:44 Sponsor 00:05:29 Uptime Kuma Setup 00:06:50 A Simple Monitor 00:13:13 Notifications 00:16:56 Status Page 00:19:03 Maintainence Tasks 00:20:35 SSH Port Monitor 00:22:40 Marker 10 00:24:00 Features I wish it had